Wednesday, April 18, 2007
ICLOUDS version 2.0 available for download.
The software has evolved to the version 2.0. This version incorporates bury and cascade routines and has improved logging. Get it from downloads page http://code.google.com/p/iclouds/downloads/list.
Monday, April 16, 2007
Okay, some progress in the code quality.
Friday, April 13, 2007
Tuesday, April 10, 2007
Beware of Windows-style line endings.
Beware of Windows-style line endings!!!
Beware of Windows-style line endings!!!
I set up and run about 10 experiments over last night to investigate the cascade behavior. Everything went wrong! Each of the runs! Why? Because each parameters line in the shell script was ending with windows ^M symbol and Apache CLI library somehow didn't get that this is the line end. I've got all runs with cascade on and d/h ratio 0.5. Nice...
Monday, April 9, 2007
Adding some unique information in the log seems to be crucial.
Just realized the urge of unique meaningful id in the each of the log files. It looks messy without it now, I'm kind of lost among couple of dozens of run logs.
Decide to add run time stamp along with name of config used:
Decide to add run time stamp along with name of config used:
## current setup: running at Friday, April 13, 2007, 10:11:40 AM HST,
config used: config_O3_2000.xml
Sunday, April 8, 2007
Fixed parameters setUp in the code.
Friday, April 6, 2007
Evolution differences between grain population with and w/o bury, 10E5
Thursday, April 5, 2007
Cascade does exactly the thing it suppose to do

The plot shows the evolution of ozone on the grain surface along with ozone evolution within the ice, buried population.
Cascade does exactly the thing it suppose to do, i.e.:
DO3 + O2 -> OD + ...
OD + CO -> D + ...
D + O3 -> OD + ...
OD + H2 -> H + ...
H + O3 -> HO + ...
OH + CO -> H ...
proof done by the log (should i post it here???):
accretion event: 9999999 got OD as the product of DO3_O2, grain popSize: 6699852
accretion event: 9999999 got D as the product of OD_CO, grain popSize: 6699852
accretion event: 9999999 got OD as the product of DO3_O2, grain popSize: 6699852
accretion event: 9999999 got H as the product of OD_H2, grain popSize: 6699853
accretion event: 9999999 got OH as the product of HO3_O2, grain popSize: 6699853
accretion event: 9999999 got H as the product of OH_CO, grain popSize: 6699853
BUT:
I little concern about timing, it is interesting, how much does it takes for this little cascade to happen at first, and second is: I THINK that there suppose to be some accretion events to happen during this time, that would obviously alter this cascade thing...
The voodoo-voodoo magic!
Some improvement done
Some improvement done. I think there was some bug in the code. So, first of all, cleaned up PopulationWithBury class to make all the names more "comprehendable" and clean. Went over chemistry cycle to see potential bottlenecks, fixed some stuff in logging, and scheduled some runs again to check. They are running now. Will get plots tonight.
Wednesday, April 4, 2007
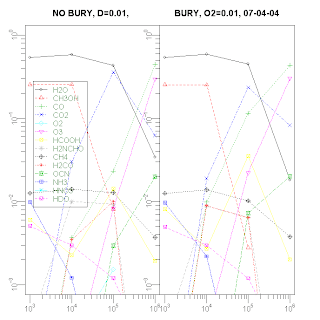
Got inconsistency in overall pattern between populations with bury and without it.

You can note different slopes (CO2) and actually values for the species abundances.
The PDF version of the plot.
Tuesday, April 3, 2007
To Do stuff
- Investigate cascade behavior through extensive logging.
introduce logging for reactions producing active productsDONErun experimentsDONE- hack the logger parser
- Plot together the simulation with bury routine turned on and turned off.
- Make separate plots for hydrogen and deuterium.
- Add something to command line to enable switching
buryand cascade on/off. - Do parallel runs with cascade switched on and off.
- Try to make plots (cascade/ no cascade) as ones in the new article.
Subscribe to:
Comments (Atom)


