
Showing posts with label Output. Show all posts
Showing posts with label Output. Show all posts
Friday, April 13, 2007
Friday, April 6, 2007
Evolution differences between grain population with and w/o bury, 10E5

I've found that three main species, H2O, CO and CO2 evolve differently in the cases when bury is switched on and off.
ESPECIALLY CO, somehow, without bury, CO stays almost constant, while with bury, it looks like it freezes in ice and gains abundance.

Thursday, April 5, 2007
The voodoo-voodoo magic!

Again, after a lot of effort to clean up the code and reveal the bug, I didn't succeed. Plots are pretty the same. :-(((( Maybe it is a feature?
Some improvement done
Some improvement done. I think there was some bug in the code. So, first of all, cleaned up PopulationWithBury class to make all the names more "comprehendable" and clean. Went over chemistry cycle to see potential bottlenecks, fixed some stuff in logging, and scheduled some runs again to check. They are running now. Will get plots tonight.
Wednesday, April 4, 2007
Got inconsistency in overall pattern between populations with bury and without it.
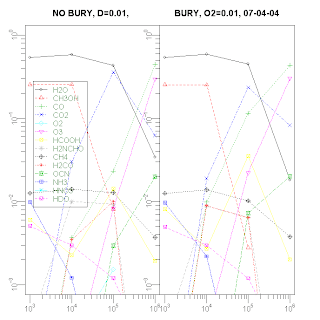
You can note different slopes (CO2) and actually values for the species abundances.
The PDF version of the plot.
Saturday, March 31, 2007
Finally done with logs and plots.

I think I finished with logs and plots for now. It seems like evolution plot looks little weird because logarithmic scale, but it is easy to transform into linear scale. The point to keep logarithmic scale for now is to emphasize that populations are not linear if we zoom in. The logarithmic plot is above, and linear below, Axis X is number of accretions events x5000, Axis Y is the population size.

Subscribe to:
Posts (Atom)