Friday, April 6, 2007

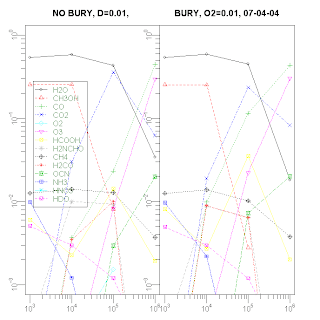
Evolution differences between grain population with and w/o bury, 10E5


I've found that three main species, H2O, CO and CO2 evolve differently in the cases when bury is switched on and off.

ESPECIALLY CO, somehow, without bury, CO stays almost constant, while with bury, it looks like it freezes in ice and gains abundance.

New plot, separated D and H species.

Thursday, April 5, 2007

Cascade does exactly the thing it suppose to do


The plot shows the evolution of ozone on the grain surface along with ozone evolution within the ice, buried population.


Cascade does exactly the thing it suppose to do, i.e.:
DO3 + O2 -> OD + ...
OD + CO -> D + ...
D + O3 -> OD + ...
OD + H2 -> H + ...
H + O3 -> HO + ...
OH + CO -> H ...
proof done by the log (should i post it here???):
accretion event: 9999999 got OD as the product of DO3_O2, grain popSize: 6699852
accretion event: 9999999 got D as the product of OD_CO, grain popSize: 6699852
accretion event: 9999999 got OD as the product of DO3_O2, grain popSize: 6699852
accretion event: 9999999 got H as the product of OD_H2, grain popSize: 6699853
accretion event: 9999999 got OH as the product of HO3_O2, grain popSize: 6699853
accretion event: 9999999 got H as the product of OH_CO, grain popSize: 6699853

BUT:
I little concern about timing, it is interesting, how much does it takes for this little cascade to happen at first, and second is: I THINK that there suppose to be some accretion events to happen during this time, that would obviously alter this cascade thing...

The voodoo-voodoo magic!


Again, after a lot of effort to clean up the code and reveal the bug, I didn't succeed. Plots are pretty the same. :-(((( Maybe it is a feature?

Some improvement done

Some improvement done. I think there was some bug in the code. So, first of all, cleaned up PopulationWithBury class to make all the names more "comprehendable" and clean. Went over chemistry cycle to see potential bottlenecks, fixed some stuff in logging, and scheduled some runs again to check. They are running now. Will get plots tonight.

Wednesday, April 4, 2007

Got inconsistency in overall pattern between populations with bury and without it.


You can note different slopes (CO2) and actually values for the species abundances.
The PDF version of the plot.

Tuesday, April 3, 2007

To Do stuff


  1. Investigate cascade behavior through extensive logging.


    • introduce logging for reactions producing active products DONE

    • run experimentsDONE

    • hack the logger parser


  2. Plot together the simulation with bury routine turned on and turned off.

  3. Make separate plots for hydrogen and deuterium.

  4. Add something to command line to enable switching bury and cascade on/off.

  5. Do parallel runs with cascade switched on and off.

  6. Try to make plots (cascade/ no cascade) as ones in the new article.